An Introduction to Gantt charts along with their Advantages & Disadvantages in Construction

Henry Gantt developed the Gantt chart in the early 1900s as a tool to manage projects. With a free Gantt Chart Template, you can easily create this type of project schedule using Excel or Google Sheets. Simple Gantt charts can be easily created using this template. Worksheet rows represent individual tasks. To start and complete each task, simply define the start and end dates.
In order to add more tasks, you can copy and paste or insert a row and copy the formula using Ctrl+d. The scroll bar allows you to change the displayed range of dates in the chart. You can update the percentage complete column to keep track of a task's status. This chart shows how many tasks have been completed.
Features of Gantt chart
Resources: People, equipment, and machines are required to complete a project. Assign resources to tasks and observe who is working on what and who needs help.
Dependencies: Each task of a project links to the next. One can see which tasks are associated with each project and how they interact. It requires that something happens in the correct order to begin the next one.
Timeline: This helps you track the progress of tasks, projects, and activities in addition to utilizing the appropriate resources.
Bars: Visually displaying the tasks and projects you're working on. Showing not only how much time has passed, but also who or what has been engaged in the task.
Advantages of Gantt chart
A. Planning & Forecasting: An easy way to visualize even complex data, Gantt charts are an excellent choice.
It is for this reason that they are so good for long-range planning. You can quickly view timelines and keep an eye on future capacity and project deadlines. Make sure you're on track to meet these milestones.
The charts are so good at predicting the future that you can use them to prevent problems from happening. Improve efficiency by smoothing out bottlenecks, adding staff to understaffed projects, and reducing overutilization. Moreover, phase dependencies can map out more precisely.
B. Various Types of Planning Accommodates: No matter how you choose to plan, be assured that the way you plan can be accommodated by Gantt charts, whether you choose Agile or Waterfall.
Furthermore, they are highly useful for all kinds of industries due to their versatility. That includes design, mining, construction, and engineering.
C. Visual Overview of Projects, Resources, Tasks: You can use Gantt charts to keep track of all your project activities. It allows you to see who is busy, how long the project will take, and what tasks depend on each other. Humans are generally visual, so planning is easier because of that. Furthermore, you can schedule your remote teams and track their progress.
Disadvantages of Gantt chart
Excel makes it easy to create Gantt charts. Anyone with even a cursory understanding of spreadsheets can create the design in just a few minutes.
Use a Gantt chart with Excel, but consider the downsides. It may be necessary to deal with a few issues. These factors may hinder your planning process.
1. Time Consuming: Gantt chart creation is not necessary. Despite that, you're probably familiar with the fact that Excel isn't easy to use. Sometimes, starting over is better than skipping some steps or missing some tasks during the process.
It is frustrating, even if it seems like it shouldn't be. A lot of time can be spent on both planning and implementation. You can waste a lot of time sharing your freshly-made plans with your teammates.
2. Hassle to make Changes: It may be necessary to move a task, or the predictions may be incorrect, or the resources may be overbooked. If you don't like the changes, you have to deal with them or start over.
Plan changes are unavoidable since plans are never final. It's your responsibility to deal with these changes in your planning schedule so hopefully, you've allotted a few hours to do so.
3. Costly Mistakes Frequently: A program like Excel tends to be less intuitive than others. Even so, this kind of information is probably not needed when planning a project. Unfortunately, it is quite easy to make mistakes. In the long run, your company and projects may suffer as a result.
? Excessive bookings.
? Inefficiency.
? Projection errors.
The project management process encompasses all of this. Excel lacks the tools necessary for addressing these issues. Making mistakes becomes more likely as a result of this. As Project Manager, you will be responsible for dealing with them.
To learn more, watch the following video tutorial.
Video Source: teamgantt
Conclusion
Gantt charts are essential for managing projects of any size and complexity. They outline key details, identify critical paths, and indicate which tasks affect the project's overall completion date. To manage all of these moving parts and still deliver your projects on time, you need a collaborative tool that allows you to plan, track, automate, and report your projects in one place.
You can visualize your projects in Gantt charts that let you adjust the duration and quantity of tasks, add conditional formatting for highlighting key tasks, and enable critical paths to see which tasks affect the completion date. To ensure that all projects complete on time and that no tasks miss sharing your Gantt chart with team members and stakeholders.
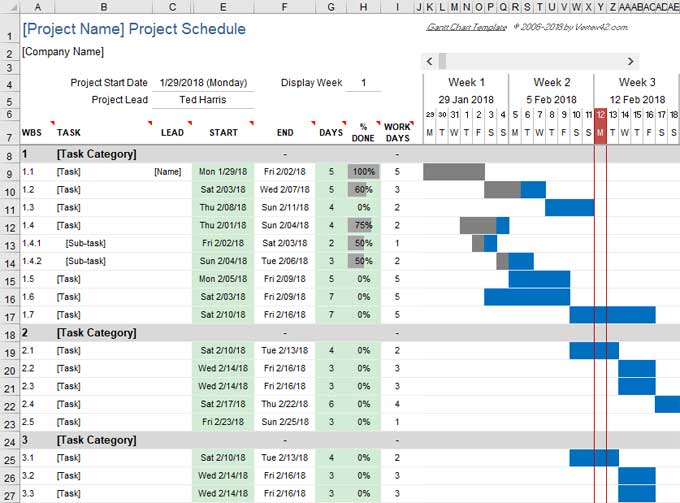
Image Courtesy: vertex42.com